
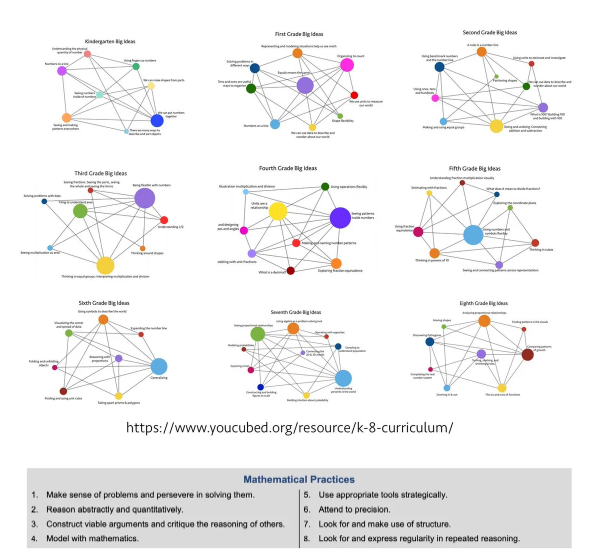
Below is an image of the different math big ideas that are focal points in each grade level from K-G8. Each big idea builds and connects to the next. The bigger the colored circle, the bigger the focus on that mathematical concept. Click here to see a 3-minute video with Jo Boaler on why big ideas are so impactful and necessary for students to think mathematically.
What do we mean when we say Big Ideas in math?
We have put together a series of what students are learning about in their current Math lab. Generally, there are about 9-10 big ideas that we explicitly teach throughout the year for each Math lab. We also integrate some Math into our learning lab projects as well. We find it quite easy to teach data handling or measurement in a transdisciplinary way through PBL (Project-based Learning). Number is the largest part of any math program or curriculum (about 60%) and can not be as easily integrated into a project as a big idea. This is why we teach Mathematics as a stand-alone subject. Approaching Math in a conceptual way also reinforces how we can approach different situations.
Mathematical practices such as problem-solving, reasoning, communication, modeling, and perseverance help to solve problems by:
1.Breaking down complex problems into simpler parts
2.Analyzing and interpreting data
3.Developing and testing solutions
4.Communicating reasoning and solutions effectively
5.Persisting in finding solutions and adjusting strategies as needed.
By using these practices, students can approach Mathematical problems in a structured, logical, and efficient manner, improving their ability to find solutions.
Math Lab 5
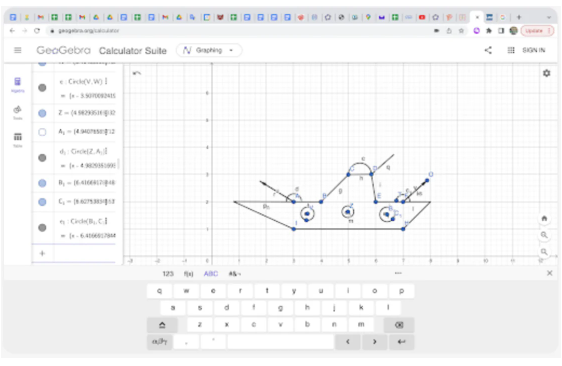
The learners in Grade 5 Math have been investigating ways to represent data on a coordinate plane. This focus of our Big Idea 4 had us finding ways to represent speed, finding relationships of different means of transportation, and even playing a classic game of Battleship with a twist. It’s important that while we explore the bigger, connecting ideas of math, we’re also ensuring everyone has a solid grasp of the basics.
Since learners typically have very different learning styles from one another, it’s also a must that we, as Learning Designers, come up with multiple ways of exposing students to important content. We have a slew of resources available at our fingertips for this reason, and one fit the bill nicely in helping learners to visually see how locations on a Cartesian plane correspond with their coordinates. called the Point Mover. Take a peek at the Headrush module to really get a feel for how well the learners grasped this! In the meantime, here is a picture:
If you have any questions regarding our new 6-Day ML Schedule, please reach out to your child’s Community Time Learning Designer. These adjustments will take some time to get used to. We are confident that this enhanced schedule will provide a quality experience for your child as they continue to develop their identity, engagement, and confidence.
Math Lab 6
Students enjoy coming to Grade 6 Math because of the bright atmosphere where the priority is making learning Math fun. During our current Big Idea 4, we’ve been working on seeing the many different ways that math can be applied to real-life situations. This Big Idea is all about seeing how coordinate planes enable us to do something that is mathematically interesting & representative of an idea, but visually. Prior to this, most learners have only experienced this in any level of true understanding in other types of graphs such as bar graphs or pie charts, so it’s a very exciting time! This is building on the learning of coordinate planes in Grade 5 Math, as one of the things we know from our extensive research while building our Math program is that repetitive exposure to important Math topics is a major key to success. Developmentally, learners are not all in the same stage at the same time.
Our approach allows for learners at the beginning of their understanding to be introduced to a topic, while learners who further along have the chance to push their application skills. For example, one of our recent learning experiences involved practicing recording isolated points without using numbers, and this skill further ranged in complexity all the way up to connecting points to create a two-dimensional shape. Finally, learners investigated patterns of repeating values of multiplication facts when placed on a quadrant, taking the form of a multiplication table. This idea was further expanded by plotting multiplication factors as coordinates to identify the patterns. One of the new methods G6 math students have learned is the Lattice Method which is a multiplication method that students enjoyed doing and joked that it was like a Christmas gift!
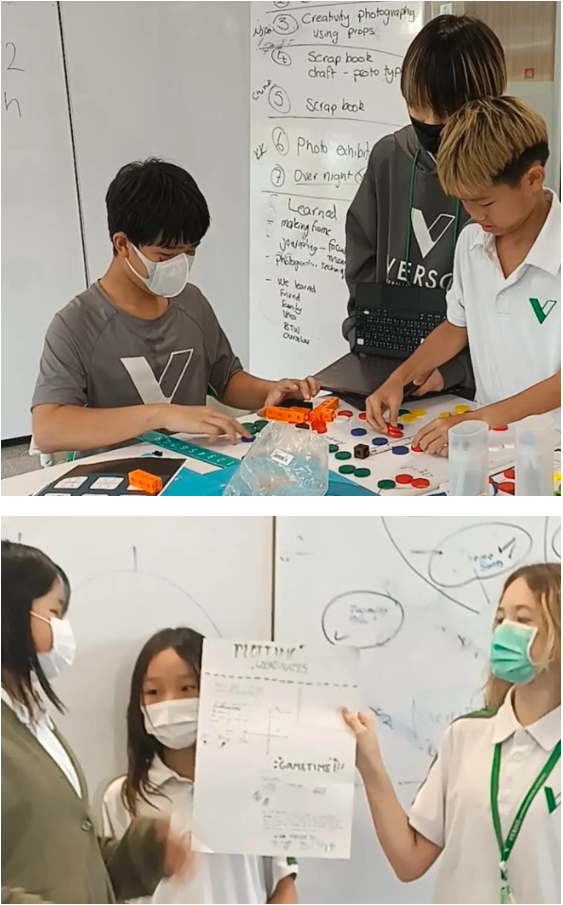
We love hearing this feedback, as viewing Math as an inaccessible subject or one that anyone is “just not good at” is as outdated as it is untrue. We can all learn Math to a high level! Here are some photos of our proud Grade 6 learners showing off their latest hard work:
Math Lab 7
The learners in Grade 7 have been working on coming up with their ultimate dream vacation project. It’s been such a great opportunity to apply what we have previously been focusing on in learning about percentages by now applying their knowledge in a real-world context. The project starts with a brief introduction on shortcuts for finding percentages for learners who are ready for this and then progresses to have students plan out their dream vacation, find the overall expense, determine their income, examine their monthly expenses, and budget for the vacation. There is so much room for learners to practice their knowledge through project parameters like discount, tax, gratuity, commission, ratios, and parts of a whole.
Additionally, students learn how to substitute into an equation, create a circle graph, and use logic to solve problems that pertain to their own life. It’s a wonderful example of our low-floor, high-ceiling approach in Math at VERSO that aims to make learning accessible to everyone at the grade level without drawing attention to ability levels.
We all have our own natural pace of processing and understanding, and it’s a wonderful thing to allow learners to develop their own intrinsic trust in that process. Working through projects such as this that are designed to be completed at the student's own pace also allows them to take their time and fully understand the concepts being taught. Overall, this project provides a fun and engaging way for students to understand and apply percentages to the real world!
Here’s a little view into what the learners were thinking about - come and visit the Headrush Grade 7 Math module with your child for a walk-through in more detail!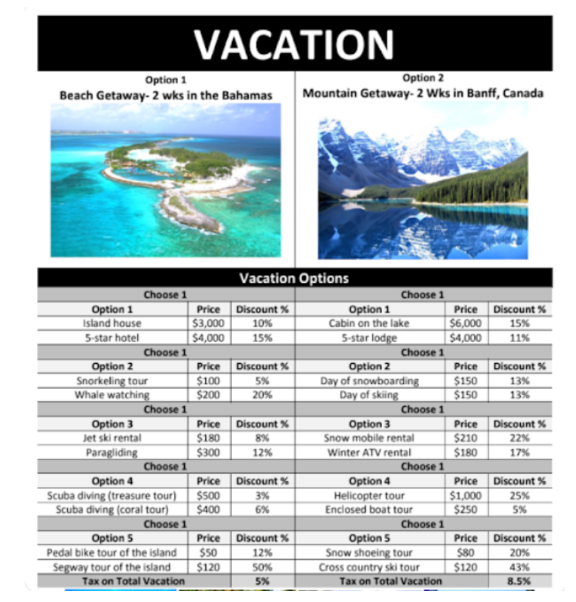
Math Lab 8
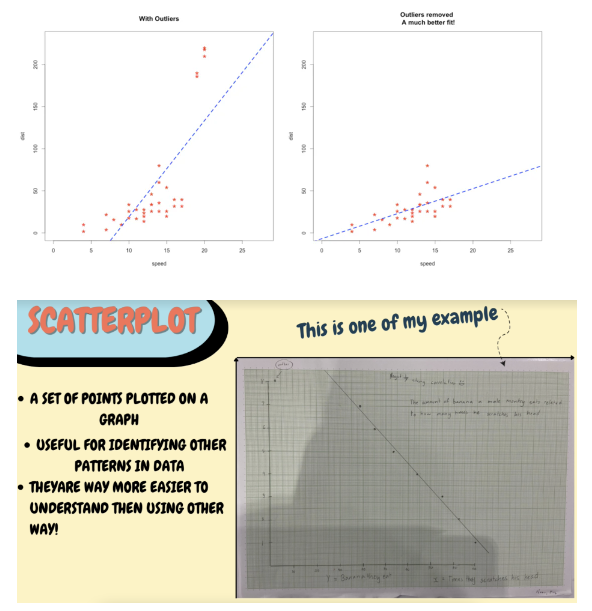
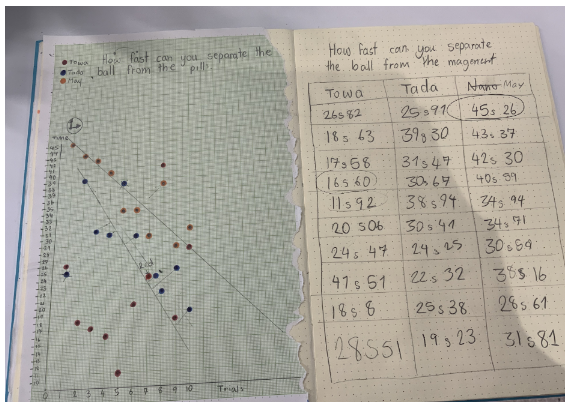
Our Grade 8 learners have been hard at work coming up with new ways to take data & organize it in a way that shows patterns in the data that relate to the overall conclusion that can be drawn from it. We’ve been doing this by gathering real-life data from a “How fast can you…” research prompt. Some of the research questions that were tried out have been “How fast can you run up 25 steps at the HUB,” “How fast can you tie your hair in a ponytail with only 1 hair tie,” and “How fast can you unlock my iPad?” This data was plotted to show that real-life data very rarely follows a perfect pattern, and can yield unexpected results that are really neat to analyze. This was a natural lead-in to learn about statistical concepts like clustering, correlation, lines of best fit, interpolation & extrapolation and opens the mind to consider a more functional analysis of data, including connecting to past learning of probability.
Learners plotted their own trend lines in order to draw educated assumptions about questions that extend beyond the facts that their data gave them, as well as how outliers - data points that don’t fit a trend line - commonly exist, why they exist, and what including them or not in a data analysis does to assumptions of the data set. Head over to the Headrush module to see your child’s homemade video compilation explaining their learning so far. This communication piece has also provided a prime opportunity for us to work on our feedback skills - giving, receiving & providing justification for incorporating feedback or not.
Check out some of the results from our learners below - one is from an EAL student who has dramatically improved their confidence in English this year and we couldn’t be more proud!
Written by Ashley
Thank you for your continued support as we work and learn together. Please reach out to us at any time if you have any questions or require further support. We are with you every step of the way.
Best wishes,
Chad and the ML Team
Share:

ML Muster: House Captains, X Time, English Tutoring
By Chad Walsh / October 04, 2024
House Captains & Shirts
By Chad Walsh / September 20, 2024


